

Calibration and Sharpness: The Two Independent Aspects of Forecast Quality
What Is a Good Forecast?
Forecasts are like friends: Trust is the most important factor (you don’t ever want your friends to lie to you), but among your trustable friends, you prefer meeting those that tell you the most interesting stories.
What do I mean with this metaphor? We want forecasts to be “good,” “accurate,” and “precise.” But what do we mean by that? Let’s sharpen our thoughts to better articulate and visualize what we want from a forecast. There are two independent ways in which forecast quality can be measured, and you need to consider both – calibration and sharpness – to get a satisfactory understanding of your forecast’s performance.
Forecast Calibration
For simplicity, let’s start with binary classification: The forecasted outcome can only take two values, “true or false,” “0 or 1,” or similar.
To be more concrete, let’s consider emails, and whether they will be tagged as spam by the mailbox user. A predictive system produces, for each email, a percentage probability that this email would be considered spam by the user (which we take to be the ground truth). Above a certain threshold, say 95%, the email then ends up in the spam folder.
To evaluate this system, you can, in the first place, check the calibration of the forecast: For those emails that are assigned an 80% spam-probability, the fraction of true spam should be around 80% (or at least not differ in a statistically significant way). For those emails that were assigned a 5% spam-probability, the fraction of true spam should be around 5%, and so forth. If this is the case, we can trust the forecast: An alleged 5% probability is indeed a 5% probability.
A calibrated forecast allows us to take strategic decisions: For instance, we can set the spam-folder threshold appropriately and we can estimate the number of false positives / false negatives upfront (it’s unavoidable that some spam makes it to the inbox, and some important emails end up in the spam folder).
Forecast Sharpness
Is calibration all there is to forecast quality? Not quite! Imagine a forecast that assigns the overall spam probability – 85% – to every email. That forecast is well calibrated, since 85% of all emails are spam or otherwise malicious. You can trust that forecast; it’s not lying to you – but it is quite useless: You can’t take any useful decision on the trivial repeated statement “the probability that this email is spam is 85%.”
A helpful forecast is one that assigns very different probabilities to different emails – 0.1% spam probability for the email from your boss, 99.9% for doubtful pharmaceutical ads, and that remains calibrated. This usefulness property is called sharpness by statisticians, as it refers to the width of the predicted distribution of outcomes, given a forecast: The narrower, the sharper.
An unindividualized forecast that always produces the spam probability 85% is maximally unsharp. Maximal sharpness means that the spam-filter assigns only 0% or 100% spam probability to every email. This maximal degree of sharpness – determinism – is desirable, but it’s unrealistic: Such forecast will (very probably) not be calibrated, and some emails marked with 0% spam probability will turn out to be spam, some emails marked with 100% spam probability turn out to be your significant other’s.
What’s the best forecast then? We don’t want to give up on trust, so the forecast needs to remain calibrated, but within the calibrated forecasts, we want the sharpest one. This is the paradigm of probabilistic forecasting, which was formulated by Gneiting, Balabdaoui and Raftery in 2007 (J. R. Statist. Soc. B 69, Part 2, pp. 243–268): Maximize sharpness, but don’t jeopardize calibration. Make the strongest possible statement, provided it remains true. As with our friends, tell me the most interesting story, but don’t lie to me. For a spam-filter, the sharpest forecast assigns values like 1% for the quite-clearly-not-spam emails, 99% to the quite-clearly-spam emails, and some intermediate value to the difficult-to-decide cases (of which there should not be too many).
An Abstract Painting of Calibration and Sharpness
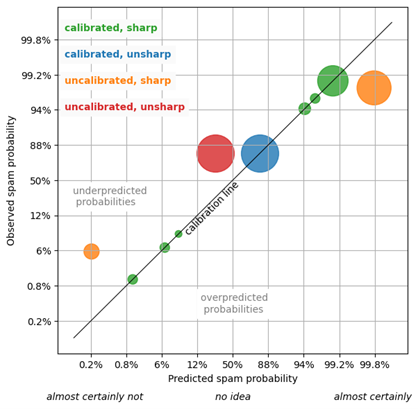
Let’s visualize the calibration and sharpness of spam classifiers in the following figure. A spam classifier is depicted by a collection of circles of the same color, such that the size of each circle reflects the number of emails that were tagged with the respective predicted spam-probability. The x-axis is the predicted spam probability, the y-axis the occurring spam frequency. The scaling of the axes is chosen in a way that details out probabilities that are either close to zero (“almost certainly not”) or close to one (“almost certainly”).
A circle, a collection of individual spam probability predictions that assume the same value, is calibrated when it lies on the calibration line, the diagonal black line for which the predicted probabilities and the measured frequencies match. The further a circle is off the calibration line, the larger is the discrepancy between prediction and actual, and the more uncalibrated is the forecast. When a circle lies above the calibration line, the associated predictions have underpredicted the true probability; when it is below the calibration line, the predictions are overpredictions. In the lower right and upper left, you would find disastrously bad predictions that assign a very large probability to rare events, or vice versa.
Consider now the green circles: The predicted probabilities and actual frequencies nicely match, for all six circles, which reflects a perfectly calibrated and rather sharp forecast. The single blue circle is calibrated (it hits the diagonal line), but it reflects a useless, unsharp forecast that only produces “85%” every time it’s asked what’s an email’s spam probability. That’s a defensive forecast: Not wrong, but useless. The orange circles reflect an overly confident spam filter: It produces 0.2% or 99.8% as spam-forecast – strong statements, which would be useful if they were true! Of the “almost certainly not spam” emails, we find, however, about 5% of spam, much more than the predicted 0.2%. Of the “almost certainly spam” emails (99.8% predicted probability), only about 95% turn out to be actual spam. That orange forecast is sharper than the green one, but it has lost its calibration. The added ostensible certainty is of no use because we cannot trust the forecast.
The red circle reflects an unsharp and uncalibrated forecast: This spam filter always assigns the probability “25%” to each email – this is both wrong (the overall probability is about 80%) and unspecific.
The paradigm of “maximal sharpness subject to calibration” means that you want to push the circles as far as possible into the “almost certain” areas, to the lower left and upper right, while they remain glued to the calibration line. We aim for strong and actionable statements like “1% spam” or “99% spam,” while these statements should be truthful.
Calibration and Sharpness in Demand Forecasts
At Blue Yonder, we don’t do spam filtering for a living, but we do produce forecasts, for instance, for customer demand. Our target is not binary (spam/no-spam), but a number. Much of the above argument can be used again: A calibrated but useless forecast assigns the overall average demand (averaged over products, locations, days) to every product-location-day in the future: “That product will sell 1.6 times on average tomorrow,” repeated for every product, day and location, is a true and calibrated statement for a typical supermarket, but no meaningful basis for replenishment or any other business decision. On the other hand, a forecast that pretends to be maximally sharp (“Tomorrow, in store 123, you will sell exactly 17 cucumbers”) is unrealistic and would hinder any meaningful strategic decisions concerning waste and stock-outs.
How sharp can retail forecasts become? In retail, we deal with many potential customers (many more than 100 per day), each of which can buy a certain product with small probability: When you enter a supermarket, you only buy from a small fraction of the products that are offered. When we additionally assume that every product enjoys perfect availability (no out-of-stocks ever) and that each customer buys at most one item of a given product, the theoretical maximally possible sharpness is known: It is the Poisson distribution, whose properties we have discussed in my previous blog “Forecasting Few is Different – Part 1.” That is, the distribution of sales around the predicted mean follows a Poisson distribution: A mean prediction of “5” comes with a finite probability that the true demand might be, for example, 3 (14% probability), 4 (18% probability), 5 (18% probability), 6 (15% probability), 7 (10% probability), etc. These predicted probabilities can, just like for our spam-filter, be verified in practice: When we assign the event “13 cucumbers” a probability of 12%, we expect that, on average, 12% of such cases will lead to 13 sold cucumbers. When we have established the calibration, we can use the forecast to take strategic decisions, such as balancing out the cost of out-of-stock and of waste.
In practice, the strong assumptions behind the Poisson distribution are often not fulfilled: People buy more items of a given product, items go out of stock, and not all factors that influence demand are known, which makes pretending to know the average buying probability elusive. The Poisson distribution nevertheless remains an approximate, albeit sometimes unreachable, ideal case, which gives great orientation. In our forecasting solutions, we compare the achieved performance in practice to different theoretical boundaries to estimate how close we are to what is possible under given circumstances. This helps us identify the low-hanging fruits for improvement, the already-excellent forecasts, and the anomalies that require further investigation.
Conclusion: How Good Forecasts Resemble Good Friends
The paradigm of “maximizing the sharpness of the predictive distributions subject to calibration” (Gneiting, Balabdaoui and Raftery) is, thus, incredibly useful to make forecasting performance tangible, in any field. Eventually, in every forecasting situation, we want to be able to say, with confidence: This is a calibrated forecast that is as sharp as possible.
That forecast is just like your most entertaining friend, who tells great stories and gives useful advice, but never lies to you.